[Return to Construction guide / CAMSIS home]
3
Preliminary models using CA: details
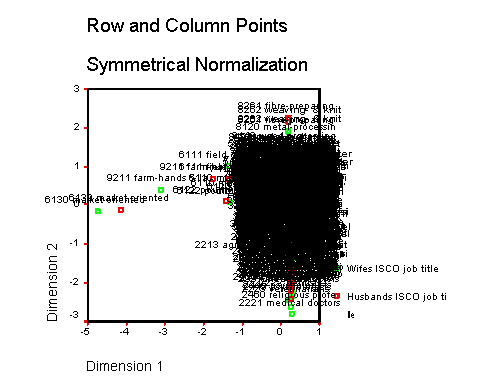
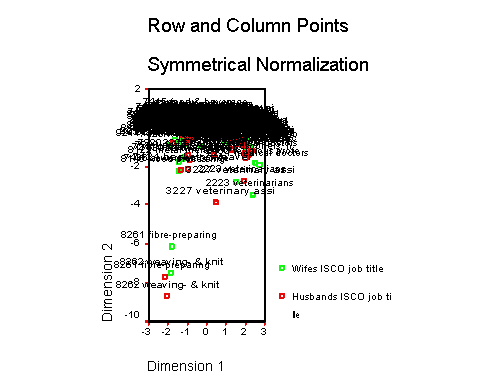
As discussed in the overview, an immediate confounding influence on the results of such models for social interaction is the presence of occupational combinations which are diagonal, or what we term 'pseudo-diagonal' (which we can also use as a term to cover both). Whilst the full range of measures taken to deal with this problem is lengthy, the most dominant features can usually be identified and catered for immediately. In the case of preliminary correspondence analysis models in particular, the graphical summaries produced by SPSS make the identification and treatment of the most significant pseudo-diagonals relatively easy : the occupations affected show up as extreme dimension scores in the initial models, and the relevant pseudo-diagonal combinations can be determined from the nature of the extreme male and female scores. (For example, if male farmers and female agricultural workers show up as extreme cases in the respective solutions, then we can guess that that combination should be treated as a pseudo-diagonal.) When the relevant pseudo-diagonals have been quickly identified, it is then possible to rerun the SPSS model on the population after excluding those cases. In most cases, after only one or a few such loops, a small range of pseudo-diagonals can be identified which, when excluded, lead to a model where scores are relatively evenly spread across the first dimension.
The first image below shows the example output of an early SPSS model using title-only units where a number of occupations stand out as extremes (the graph represents a two-dimensional plot of the scores assigned to the male and female occupational title units). The second graph then shows output from a model where, after excluding cases associated with a few simple peudo-diagonal combinations as identified in the first graph, a more satisfactory primary dimension structure has emerged (the 'mess' on the diagrams illustrates the close positions of several hundred occuaptional titles, where the identifiable points are extremes in the relevant dimensions; note that the second diagram still indicates a model with extreme outliers in the second dimension, but the primary dimensional structure is more evenly spread).
We find at this stage that it is useful to conduct such preliminary SPSS CA models on a range of alternative occupational base units. If, for example, we have information on occupational major and minor groups, and employment status groups, we can try out the same models on the title-only, title-by-status, status only, minor group, minor group-by-status, major group, and major group-by-status units, and so on. Using the 'raw' data, the ability to construct the models is not adversely affected by the existence of very sparsely represented base units (although our confidence in generalising from them may be). However the ability to construct the model can be limited to a maximum number of possible base units, and if no (sparse) occupational units have been combined it is often the case, for example, that the title-by-status, and sometimes the title-only and minor group-by-status, base units contain more categories than the SPSS proceedures can handle. Even when this is the case, however, the basic preliminary analysis described can be used to produce results from a number of base units, and thus give initial information on the nature of social associations between occupations.
Having run these models, we typically save the results of the 'raw' data occupational patterns and utilise them in the later stages of model construction. A simple way of storing these results is to paste from the SPSS output from the relevant window into Excel, but there are many alternative strategies.
3.2
Users may choose whichever variants of the alternative SPSS procedures
they find most appropriate. In our experience, the 'correspondence' procedure
in SPSS can be memory intensive, although it does produce results in SPSS output
tables which are easily pasted into Excel. On the other hand, we find the 'anacor'
procedure to be less intensive, although its results are produced by default in
plain text outputs which are truncated as output in newer versions of SPSS. We
suggest the most convenient working technique is to run a series of anacor commands
as part of an SPSS 'production job'
using the 'production manager' facility, as illustrated in the accompanying file.
Using this technique, the output file generated by the production job can be opened
as an html file in a web browser, then the relevant output sections pasted into,
for example, Excel.
Return
to Construction guide